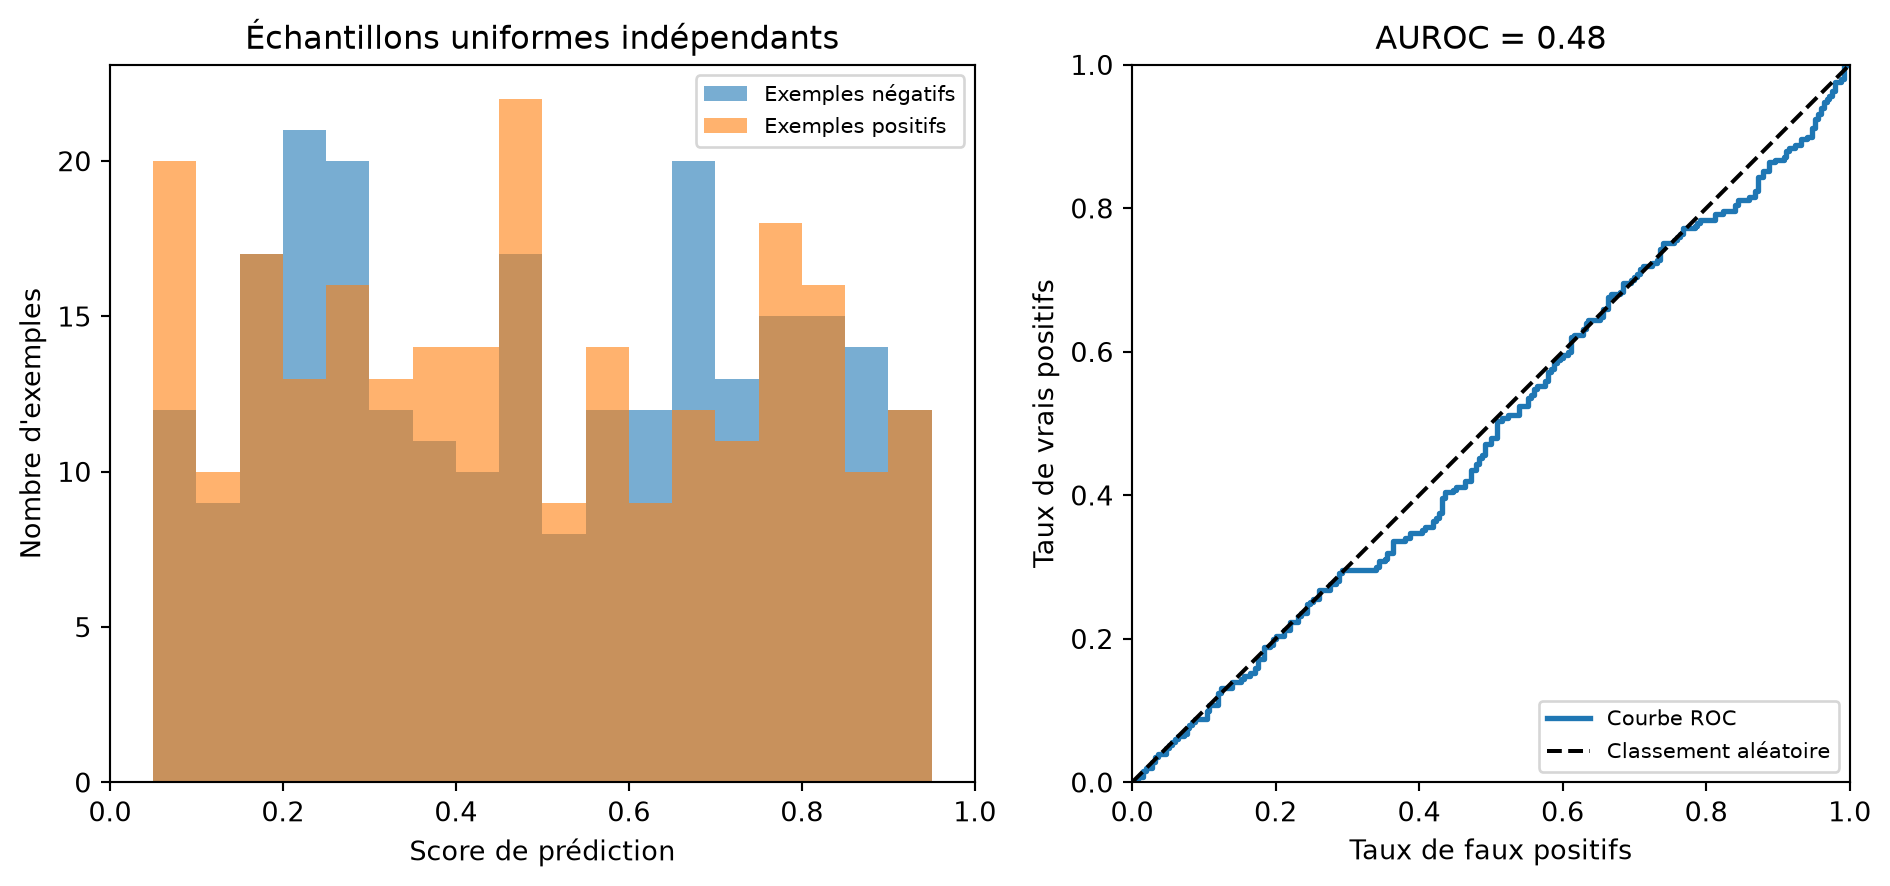
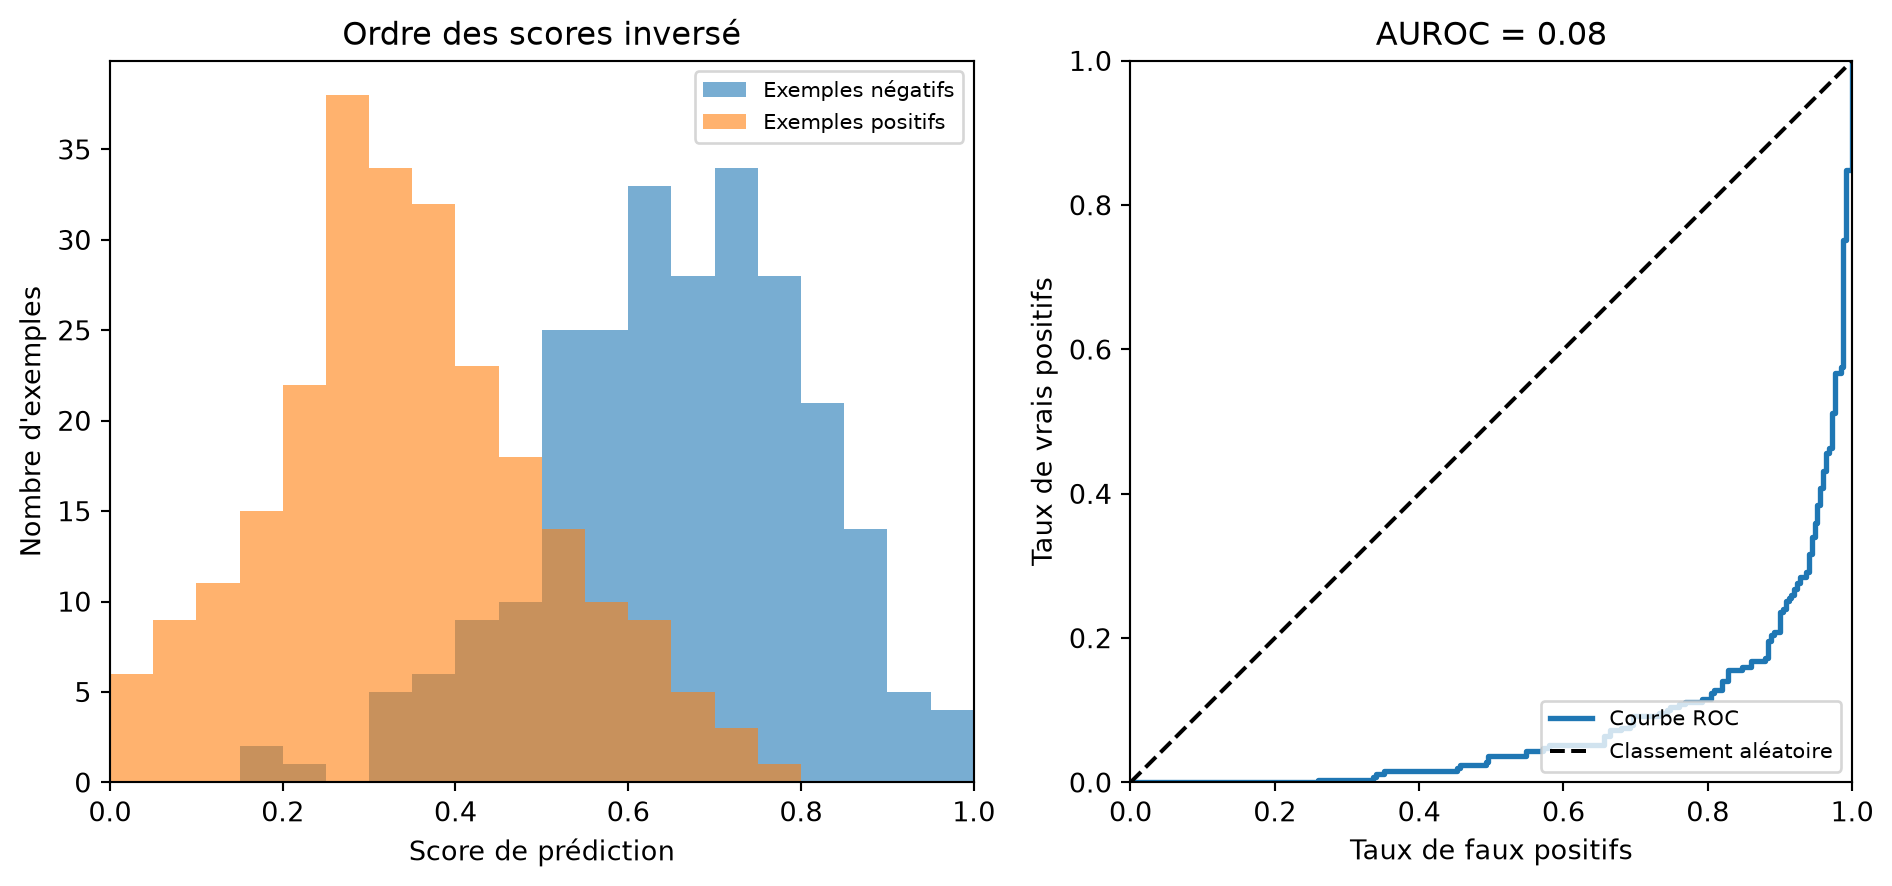
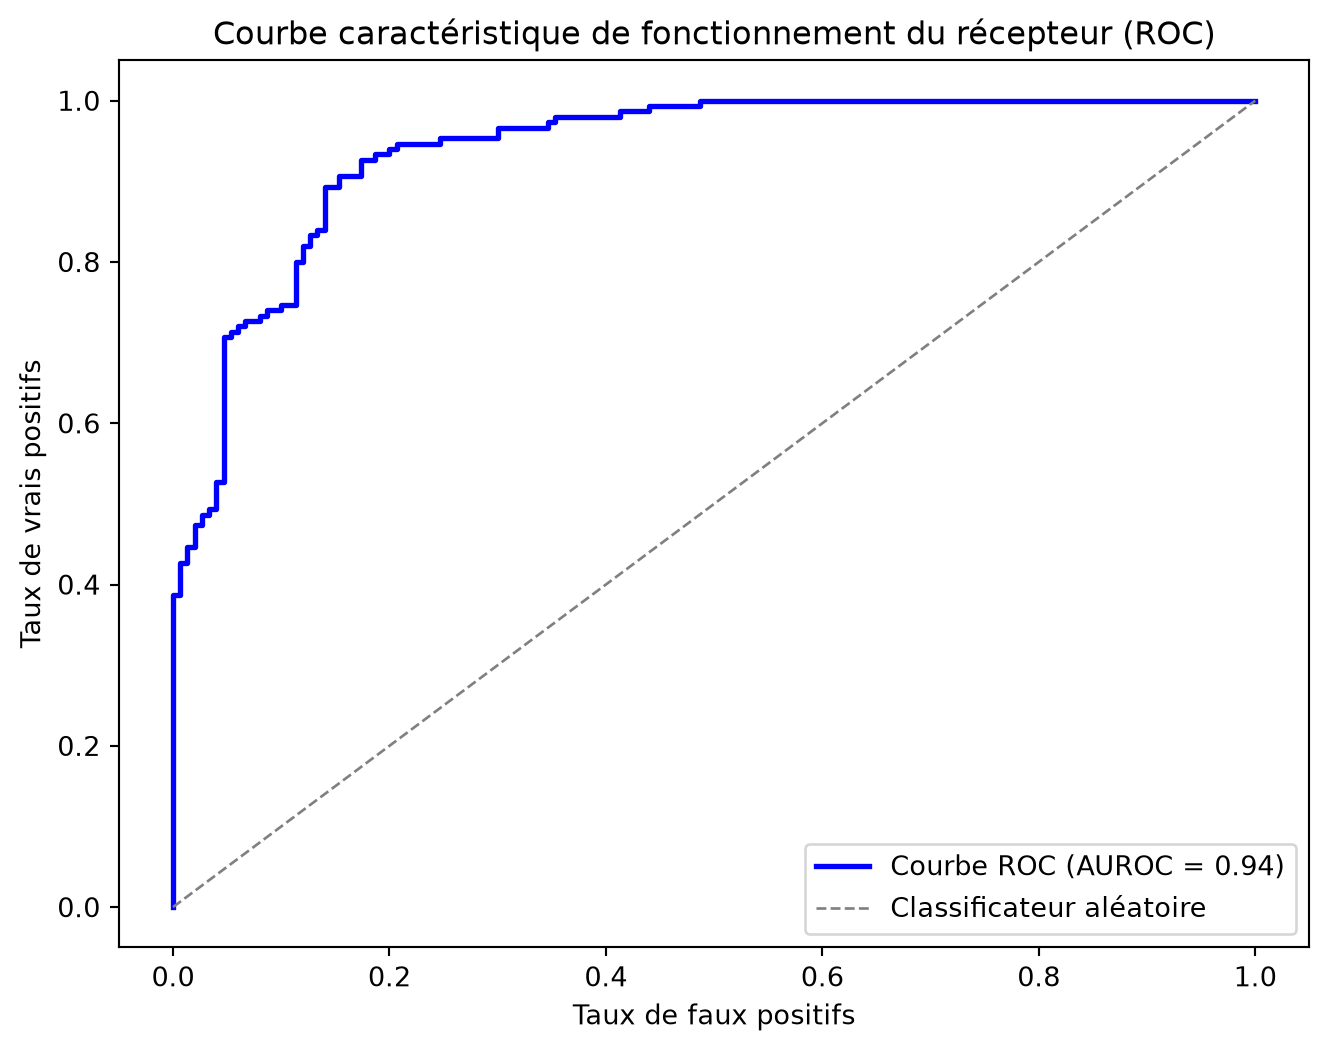
from sklearn.metrics import roc_auc_score, roc_curve

def plot_scores_and_roc(
    ax_scores,
    ax_roc,
    negative_scores,
    positive_scores,
    title,
    threshold=None,
):
    """Tracer les distributions des scores et leur courbe ROC."""
    labels = np.concatenate([
        np.zeros(len(negative_scores), dtype=int),
        np.ones(len(positive_scores), dtype=int),
    ])
    scores = np.concatenate([negative_scores, positive_scores])

    bins = np.linspace(0, 1, 21)
    ax_scores.hist(
        negative_scores,
        bins=bins,
        alpha=0.6,
        label="Exemples négatifs",
    )
    ax_scores.hist(
        positive_scores,
        bins=bins,
        alpha=0.6,
        label="Exemples positifs",
    )
    ax_scores.set(
        title=title,
        xlabel="Score de prédiction",
        ylabel="Nombre d'exemples",
        xlim=(0, 1),
    )

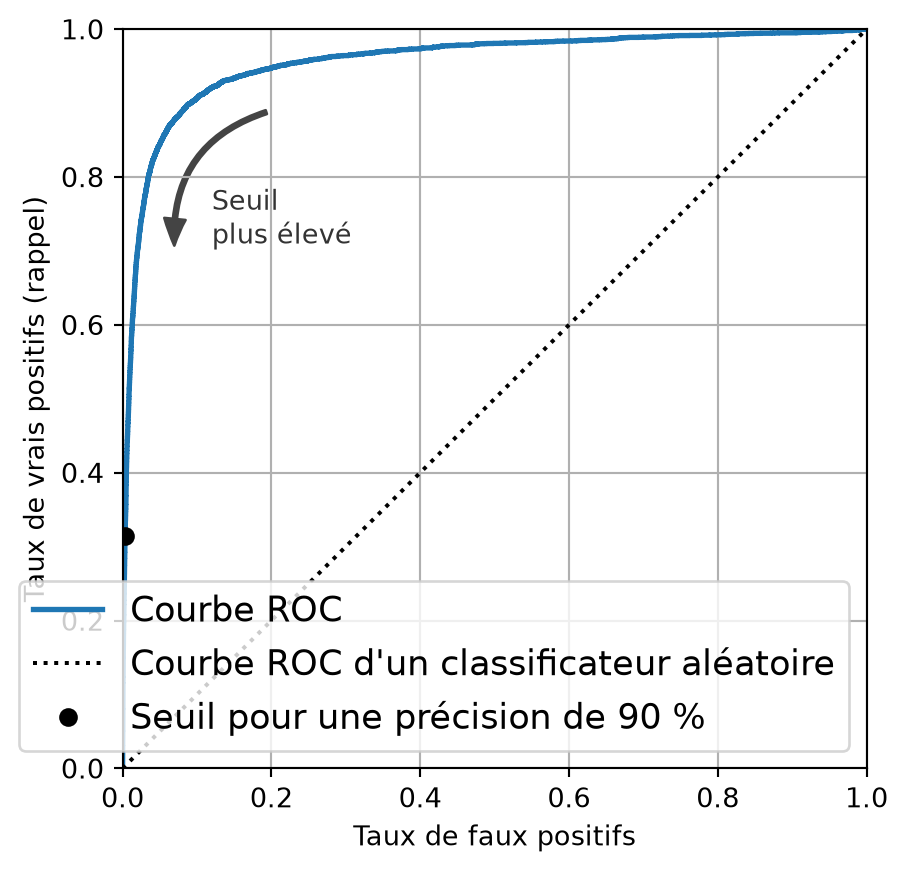
    curve_fpr, curve_tpr, _ = roc_curve(labels, scores)
    area = roc_auc_score(labels, scores)
    ax_roc.plot(curve_fpr, curve_tpr, linewidth=2, label="Courbe ROC")
    ax_roc.plot([0, 1], [0, 1], "k--", label="Classement aléatoire")
    ax_roc.set(
        title=f"AUROC = {area:.2f}",
        xlabel="Taux de faux positifs",
        ylabel="Taux de vrais positifs",
        xlim=(0, 1),
        ylim=(0, 1),
    )
    ax_roc.set_aspect("equal", adjustable="box")

    if threshold is not None:
        predictions = (scores >= threshold).astype(int)
        tn, fp, fn, tp = confusion_matrix(
            labels,
            predictions,
            labels=[0, 1],
        ).ravel()
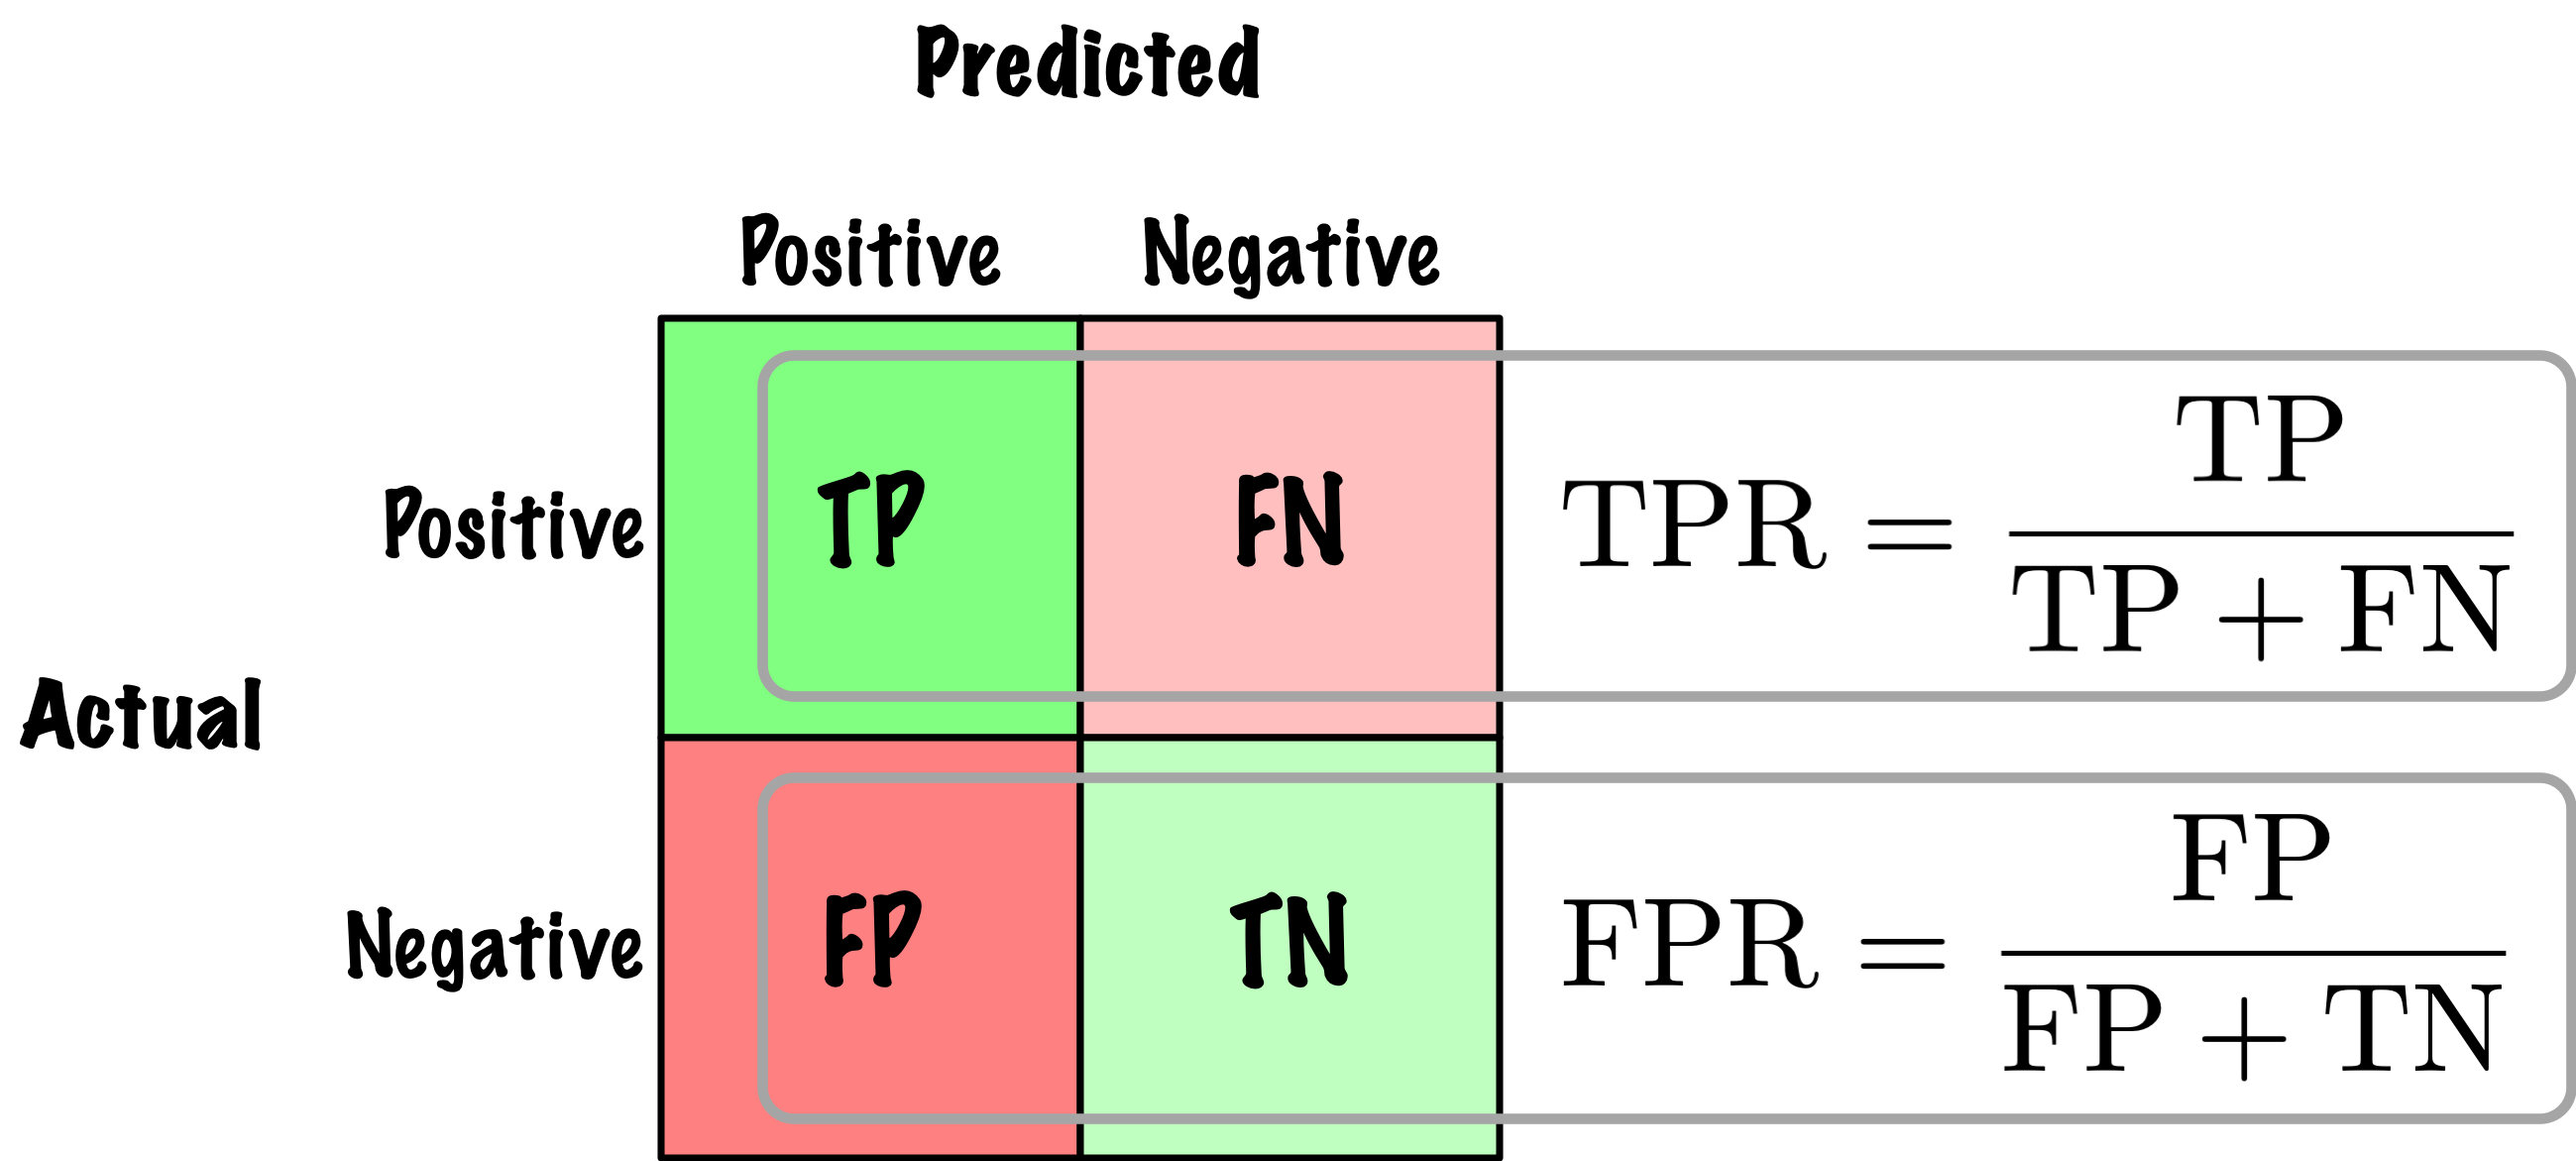
        point_fpr = fp / (fp + tn)
        point_tpr = tp / (tp + fn)
        accuracy = np.mean(predictions == labels)

        ax_scores.axvline(
            threshold,
            color="black",
            linestyle=":",
            label=f"Seuil = {threshold:.2f}",
        )
        ax_scores.text(
            0.02,
            0.95,
            f"Exactitude = {accuracy:.2f}",
            transform=ax_scores.transAxes,
            va="top",
        )
        ax_roc.scatter(
            point_fpr,
            point_tpr,
            color="black",
            zorder=3,
            label="Seuil sélectionné",
        )

    ax_scores.legend(fontsize=8)
    ax_roc.legend(fontsize=8, loc="lower right")


roc_demo_rng = np.random.default_rng(seed)
roc_demo_size = 250
good_negative_scores = np.clip(
    roc_demo_rng.normal(0.35, 0.16, roc_demo_size),
    0,
    1,
)
good_positive_scores = np.clip(
    roc_demo_rng.normal(0.65, 0.16, roc_demo_size),
    0,
    1,
)

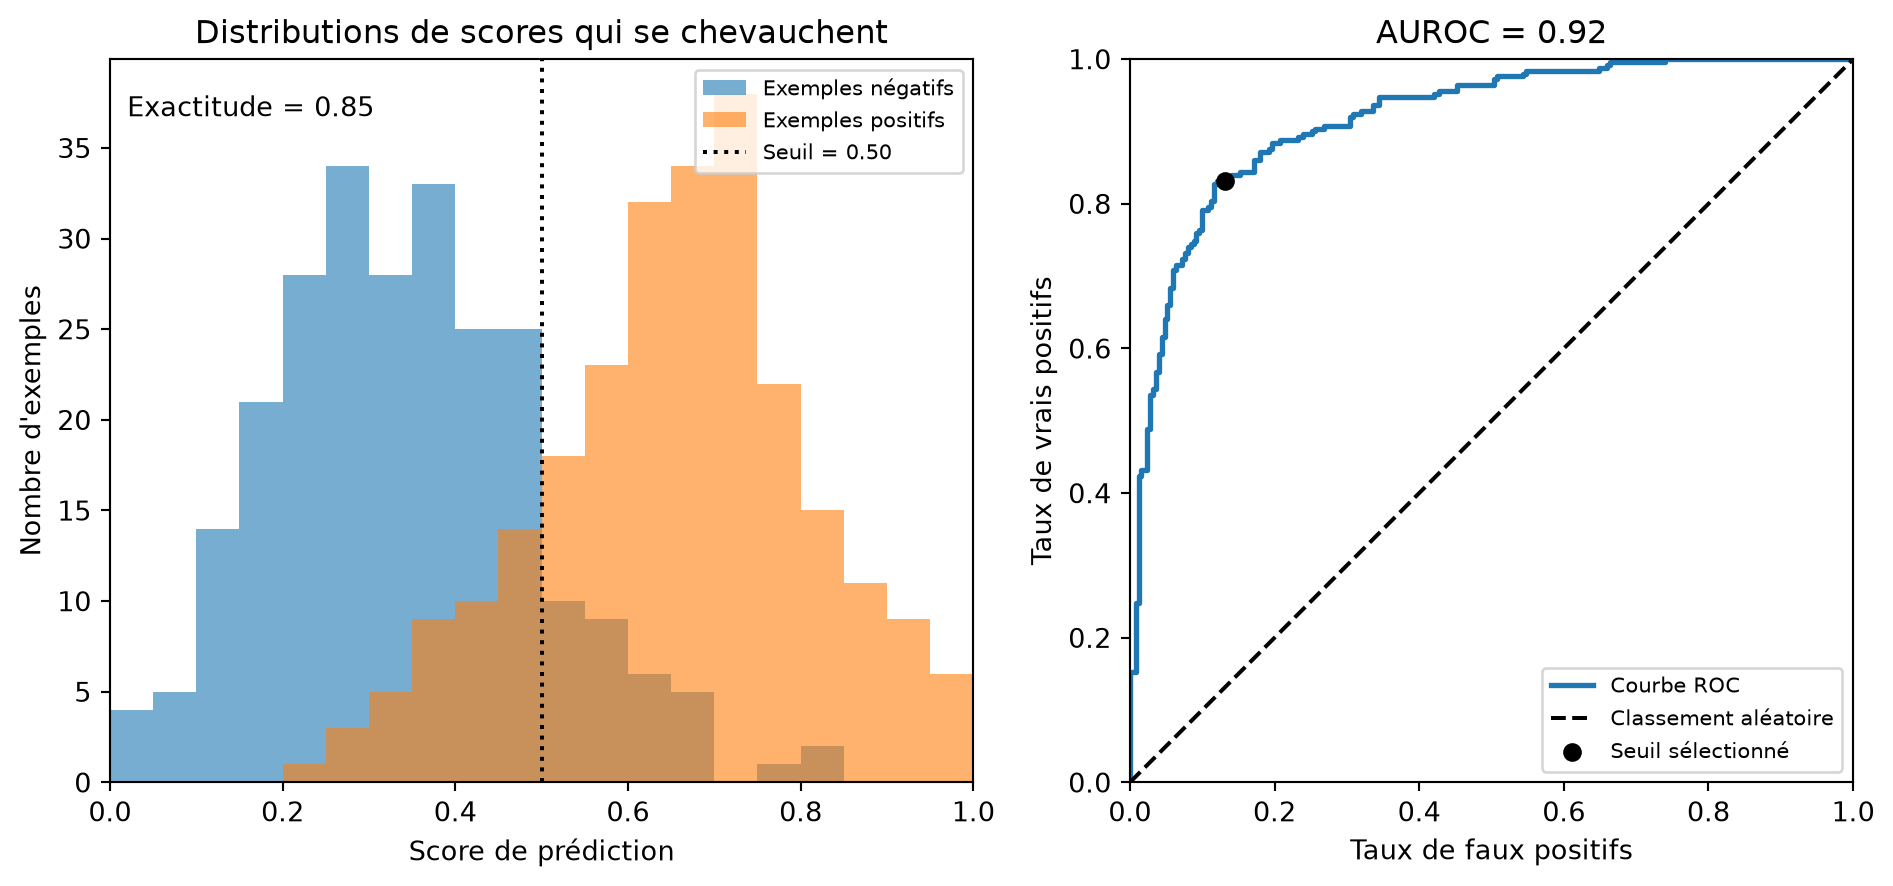
fig, axes = plt.subplots(1, 2, figsize=(10, 4.5), constrained_layout=True)
plot_scores_and_roc(
    axes[0],
    axes[1],
    good_negative_scores,
    good_positive_scores,
    "Distributions de scores qui se chevauchent",
    threshold=0.50,
)
plt.show()